1. ONGC Performance Highlights : FY'15
- Continuous decline in production of crude oil over last seven years has been reversed. Offshore oil production has gone up by 4.3% rising from 15.51 MMT (FY'14) to 16.18 MMT (FY'15).
Total ONGC crude oil production has gone up from 22.25 MMT (FY'14) to 22.26 MMT (FY'15). - ONGC has notified 22 hydrocarbon discoveries this year (10 New Prospects and 12 new pool). These include 7 oil discoveries; 6 oil & gas bearing; and 9 are gas discoveries. Last year ONGC made 14 hydrocarbon discoveries.
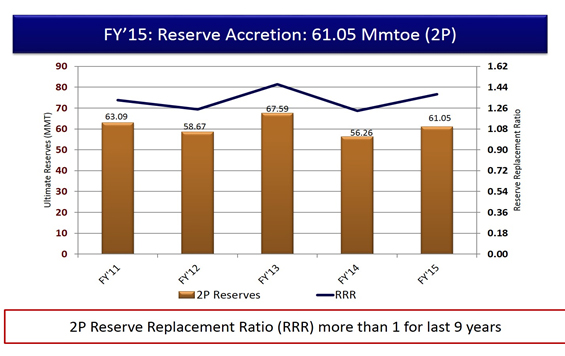
- The estimated accretion to In-place Hydrocarbons from ONGC operated areas in India in 2014-15 stands at 215.65 MMTOE. Accretion to ultimate 2P Reserves of ONGC (Domestic Stand-alone operated areas) during the year 2014-15 was रू 61.05 MMTOE.
- Reserve Replacement Ratio (RRR), the ratio of reserve accretion to total oil and gas production in one year, stands at 1.38. ONGC, thus, maintains RRR at more than one for last 9 years (2P). Considering the global trend, this is a significant achievement.
- Gross Revenue ₹ 83,094 Crore (against ₹ 84,201 Crore in FY'14)
- Net Profit ₹ 17,733 Crore (against ₹ 22,095 Crore in FY'14)
- Board recommended final dividend of 10% in addition to interim dividend of 180% paid earlier.
- Board in its meeting on 28th May, 2015 also approved investment of रू 1881.22 Crore for Redevelopment of Gamij field under Stage Gate Process at Ahmedabad Asset. Gamij field, located in East of Ahmedabad city, is the first Onshore field being developed under Stage Gate Process. The project cost includes drilling of 280 wells and creation of surface facilities like Group Gathering Stations
- Cairn Energy India Private Limited has handed over Operatorship of NELP block Nagayalanka KG-ONN-2003/1 to ONGC. ONGC, as the Operator, has made plans to drill 20 horizontal wells - 2 in Phase I and 18 in Phase II - with multistage Hydro-fracturing in High Pressure – High Temperature domain. The project cost is around रू 5,000 Crore. It is envisaged to produce 2.54 MMT of oil and 1.31 BCM of gas by 2030-31.
2. Ultimate Reserve Accretion : FY'15
| (in MMToe) | |
|---|---|
| ONGC operated domestic areas | 61.05 |
| Domestic JVs | -1.03 |
| Total Domestic | 60.02 |
3. Reserve Replacement Ratio (RRR) of ONGC-operated domestic areas
4. Balance Recoverable Reserves as on 31st March, 2015
| (in MMToe) | ||||
|---|---|---|---|---|
| Domestic | Overseas (ONGC Videsh) |
Total | ||
| ONGC | JV | |||
| 1P | 711.24 | 22.56 | 202.64 | 936.44 |
| 2P | 1051.17 | 26.95 | 612.07 | 1690.19 |
| 3P | 1359.01 | 28.10 | 647.49 | 2034.60 |
5. Physical and Financial Results
| Production Performance | ||||||
|---|---|---|---|---|---|---|
| Particulars | Q4FY'15 | Q4FY'14 | % Var | FY'15 | FY'14 | % Var |
| Crude Oil – ONGC (MMT) | 5.54 | 5.53 | 0.18 | 22.26 | 22.25 | 0.04 |
| Crude Oil – JV (MMT) | 0.91 | 0.94 | - 3.19 | 3.68 | 3.74 | - 1.60 |
| Total Crude Oil – (MMT) | 6.45 | 6.47 | - 0.31 | 25.94 | 25.99 | - 0.19 |
| Gas – ONGC (BCM) | 5.43 | 5.81 | - 6.54 | 22.02 | 23.28 | 5.41 |
| Gas – JV (BCM) | 0.38 | 0.36 | 5.55 | 1.50 | 1.57 | - 4.46 |
| Total Gas (BCM) | 5.81 | 6.17 | - 5.83 | 23.52 | 24.85 | - 5.35 |
| O+OEG (MMTOE) | 12.26 | 12.64 | - 3.01 | 49.46 | 50.84 | - 2.71 |
| VAP (KT) | 622 | 746 | -16.6 | 2,723 | 3,017 | -9.7 |
| Financial Performance ( in Crore) | ||||||
| Particulars | Q4FY'15 | Q4FY'14 | % Var | FY'15 | FY'14 | % Var |
| Gross Revenue | 21,683 | 21,403 | 1.3 | 83,094 | 84,201 | -1.3 |
| Profit Before Tax (PBT) | 6,256 | 6,977 | -10.3 | 26,555 | 32,433 | -18.1 |
| Profit After Tax (PAT) | 3,935 | 4,889 | -19.5 | 17,733 | 22,095 | -19.7 |
6. Impact of under-recovery discount to OMCs on Profits
| ( ₹ in Crore) | ||||||
|---|---|---|---|---|---|---|
| 2014-15 | 2013-14 | 2012-13 | 2011-12 | 2010-11 | 2019-10 | |
| Discount (Contribution to under-recovery) | 36,300 | 56,384 | 49,421 | 44,466 | 24,892 | 11,554 |
| Impact on Statutory Levies | 5,340 | 8,628 | 7,362 | 6,667 | 3,558 | 1,629 |
| Impact on Profit before tax | 30,960 | 47,756 | 42,059 | 37,799 | 21,334 | 9,925 |
| Impact on Profit after tax | 20,437 | 31,525 | 28,413 | 25,535 | 14,247 | 6,551 |
7. Impact of Discount on Retention Price of Crude Oil:
| Particulars | FY'15 | FY'14 | ||
|---|---|---|---|---|
| Q4 | Year | Q4 | Year | |
| A. In USD per Bbl | ||||
| Pre-Discount Price | 55.63 | 85.28 | 106.65 | 106.72 |
| Discount | ----- | 40.41 | 73.87 | 65.75 |
| Post-Discount Price | 55.63 | 44.87 | 32.78 | 40.97 |
| B. Average₹ /USD Exchange Rate | 62.25 | 61.15 | 61.79 | 60.50 |
| C. in ₹ per Bbl | ||||
| Pre-Discount Rate | 3,463 | 5,215 | 6,590 | 6,456 |
| Discount | ----- | 2,471 | 4,564 | 3,978 |
| Post-Discount Price | 3,463 | 2,744 | 2,026 | 2,478 |
8. Dividend payout during the last five years (ONGC Standalone)
| (₹ in Crore) | ||||||
|---|---|---|---|---|---|---|
| Year | PAT | Dividend | Tax on Dividend |
Payout % | ||
| % | in Crore | Including Dividend Tax | Excluding Dividend tax | |||
| 2009-10 | 16,768 | 330* | 7,058 | 1,162 | 49.02 | 42.09 |
| 2010-11 | 18,924 | 175 | 7,486 | 1,215 | 45.98 | 39.56 |
| 2011-12 | 25,123 | 195 | 8,342 | 1,329 | 38.49 | 33.20 |
| 2012-13 | 20,926 | 190 | 8,128 | 1,301 | 45.06 | 38.84 |
| 2013-14 | 22,095 | 190 | 8,128 | 1,381 | 43.04 | 36.79 |
| 2014-15 | 17,733 | 190 | 8,128 | 1,626 | 55.00 | 45.83 |
9. Consolidated Results
- Consolidated Turnover ₹ 166,067 Crore (6.8% down from ₹ 178,205 Crore in FY'14)
- Consolidated Net Profit (PAT) ₹ 18,334 Crore (31% down from ₹ 26,507 Crore in FY'14)
10. ONGC Group of companies
| 1. | Oil and Natural Gas Corporation Ltd |
| 2. | Subsidiaries: |
| i | ONGC Videsh Ltd (Consolidated) |
| ii | Mangalore Refinery and Petrochemicals Ltd (Consolidated) |
| iii | ONGC Mangalore Petrochemicals Ltd |
| 3. | Joint Venture Entities: |
| i | Petronet LNG Ltd |
| ii | Petronet MHB Ltd |
| iii | Mangalore SEZ Ltd (Consolidated - Unaudited) |
| iv | ONGC Petro Additions Ltd |
| v | ONGC Tripura Power Company Ltd (Consolidated) |
| vi | ONGC TERI Biotech Ltd |
| vii | Dahej SEZ Ltd (Unaudited) |
| 4. | Associate: |
| i | Pawan Hans Helicopters Ltd (Unaudited) |
11. ONGC Videsh Ltd
| Production | Unit | FY'15 | FY'14 |
|---|---|---|---|
| Crude Oil | MMT | 5.53 | 5.49 |
| Natural Gas | BCM | 3.34 | 2.87 |
| Total Oil and Oil Equivalent Gas | MMTOE | 8.87 | 8.36 |
During FY'15, there is an increase in oil and gas production by 6.19% (Oil 0.86% and Gas 16.37%) as compared to previous fiscal year FY'14. The incremental production is primarily due to better management and addition in the portfolio from BC-10 ( Brazil), Sakhalin-I (Russia) and block A-1/A-3 in Myanmar.
| Financial | Unit | FY'15 | FY'14 |
|---|---|---|---|
| Gross Revenue | Crore | 19,149 | 22,224 |
| Profit After Tax | Crore | 1,904 | 4,445 |
Despite higher production during FY'15, the decrease in profit is mainly due to lower oil prices, higher financing cost including exchange loss, higher depletion charge, and impairment provision in one of the assets.
ONGC Videsh is currently producing about 182 thousand barrels of oil and oil equivalent gas per day and has total oil and gas reserves (2P) of about 612 MMtoe as on 31st March 2015.
ONGC Videsh has participation in 36 projects in 17 countries including Azerbaijan, Kazakhstan, Russia, Brazil, Colombia, Venezuela, Iraq, Syria, Libya, South Sudan, Sudan, Mozambique, Bangladesh, Myanmar, Vietnam and New Zealand. Out of these 36 projects, 13 are producing, 4 are discovered/under development, 17 are exploratory and remaining 2 are pipeline projects.
12. Mangalore Refinery and Petrochemicals Ltd (MRPL)
- Crude thruput:
The Company recorded a Highest-ever Crude throughput of 14.65 MMT as against 14.55 MMT during FY 2013-14.
Turnover
The turnover stood at ₹ 62,412 Crore during the year as against ₹ 75,227 Crore during FY 2013-14. There is after tax loss of ₹ 1,712 Crore (against profit of ₹ 601 Crore in FY14). Despite increase in throughput, the decline in turnover value is due to steep fall in product prices and inventory and exchange losses. - PHASE III REFINERY PROJECT:
All the units of Phase III Refinery Project have been commissioned during FY'15; except Polypropylene unit which has already been commissioned during May'15.
For further information, please visit our website www.ongcindia.com
Conversion Rates:
₹ -USD: 61.15 (average for the Year FY'15)
₹ -USD: 60.50 (average for the Year FY'14)
Listing references (as on 27th May 2015):
| ONGC | BSE – ₹ 331.25 NSE – ₹ 332.00 |
| MRPL | BSE – ₹ 66.95 NSE – ₹ 67.00 |
Disclaimer
This Press Release is intended to apprise the public regarding the highlights of Audited Financial Results of ONGC on standalone and consolidated basis, for the year ended 31st March, 2015 drawn up in accordance with Clause 41 of the Listing Agreement with stock exchanges and approved by the Board of Directors in their meeting held on 28.05.2014, in addition to informing about other major and / or related highlights/ developments which in view of the management may be considered as important. These are not to be taken as forward looking statements and may not be construed as guidance for future investment decisions by investors / stakeholders.
Issued By
Oil and Natural Gas Corporation Ltd.
Corporate Communications, New Delhi,
Phone: +91-11-23320032
Tele-Fax: 011-23357860
Mail: ongcdelhicc@ongc.co.in


